What happened at the 2014 midterm election

Roles involved: Design and web implementation
Project link: http://interactives.ap.org/2014/congress-balance/
November 2014
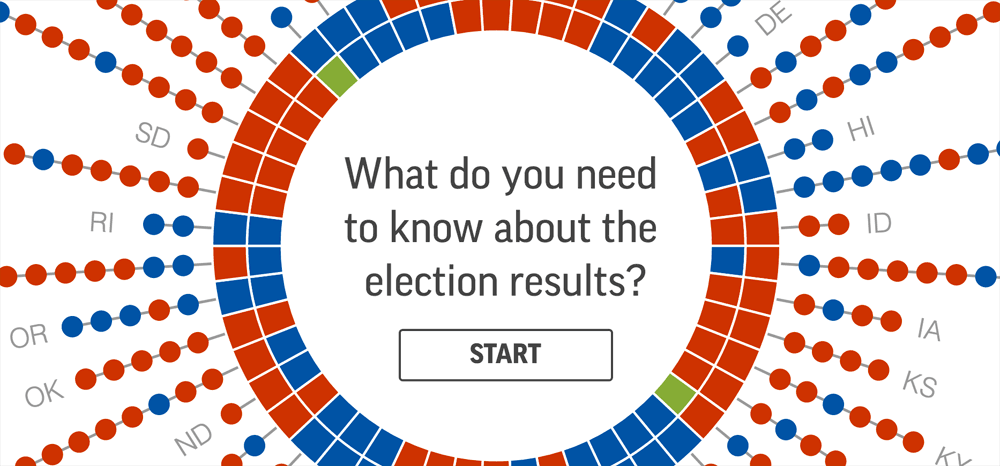
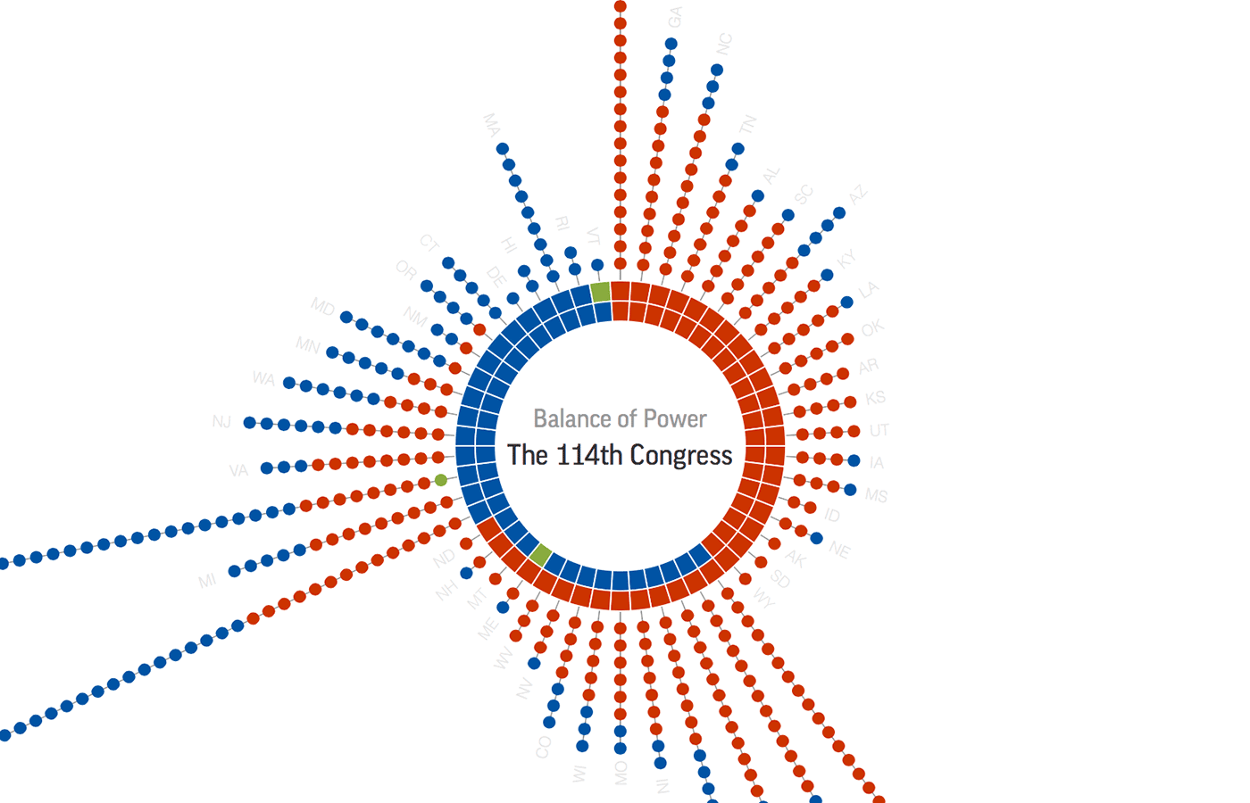
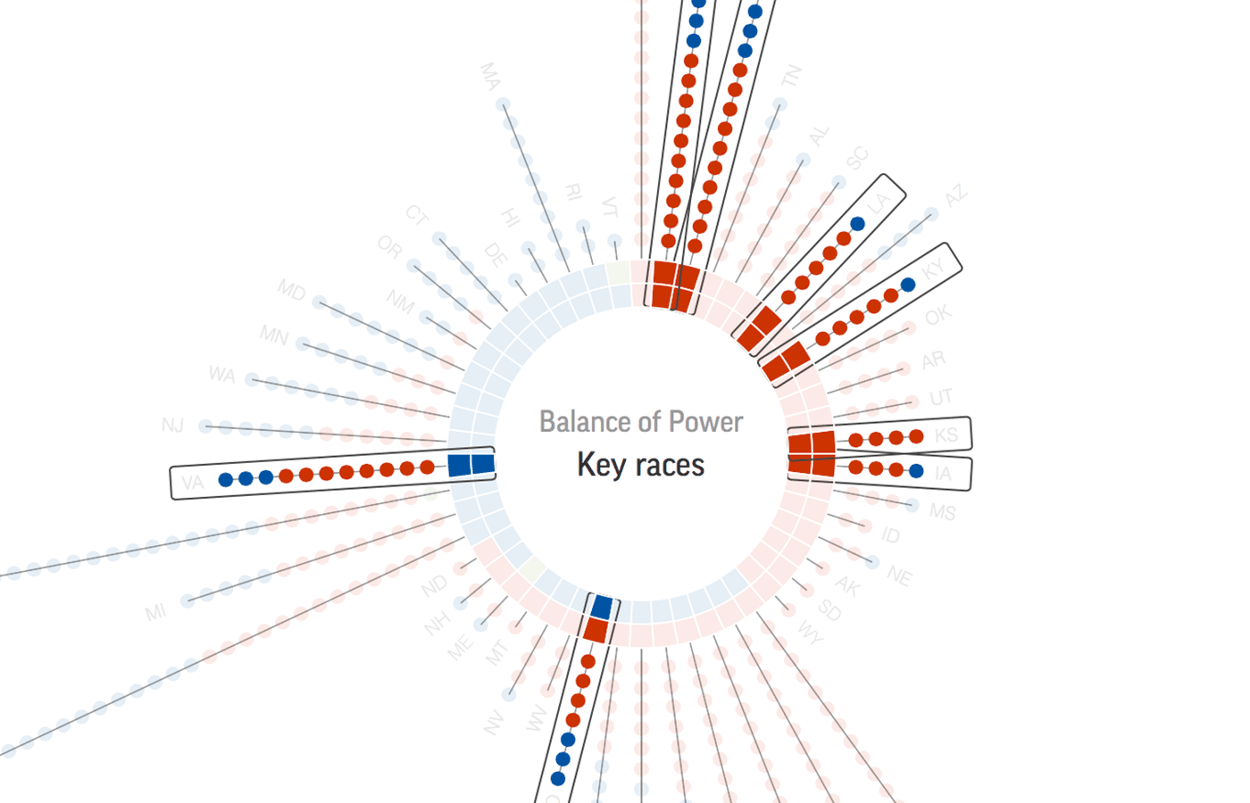
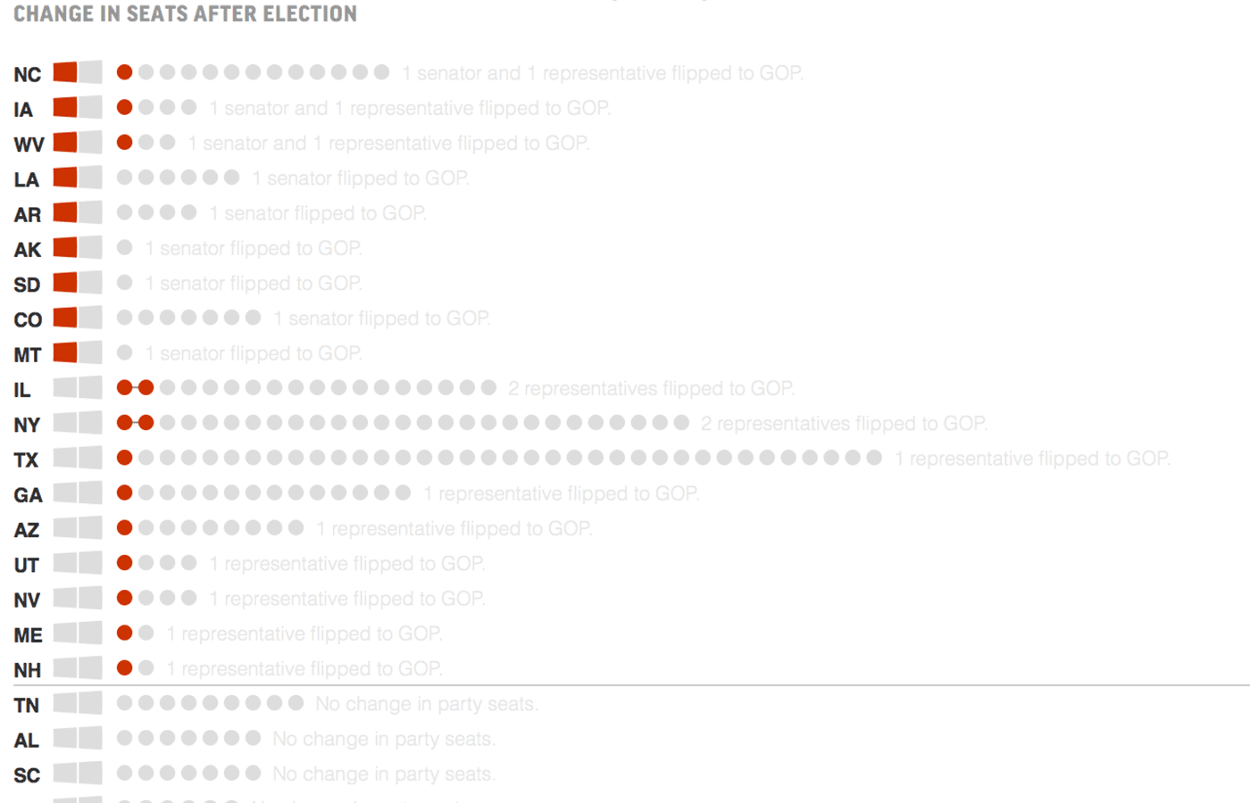
The midterm election was a big win for the Republican party. The visualization showed the status of the Congress after the election and the changes took place. Because the visualization was intended for a second day “things to know”, working with the team, I settled on an innovative design approach to accompany the traditional maps or the balance-of-power bars used for AP live results interactives.
A stepper is used to walk users through the visualization before they start exploring on their own.


